
What a 3 a.m. World Cup kick-off revealed about the Swiss grid.
Swiss consumption ignored two overnight World Cup games while they were being played. Then the country woke up two hours early, and the morning ramp ran more than a gigawatt above forecast.
Orvio Research
By Orvio
Published by Orvio Energy Intelligence AG
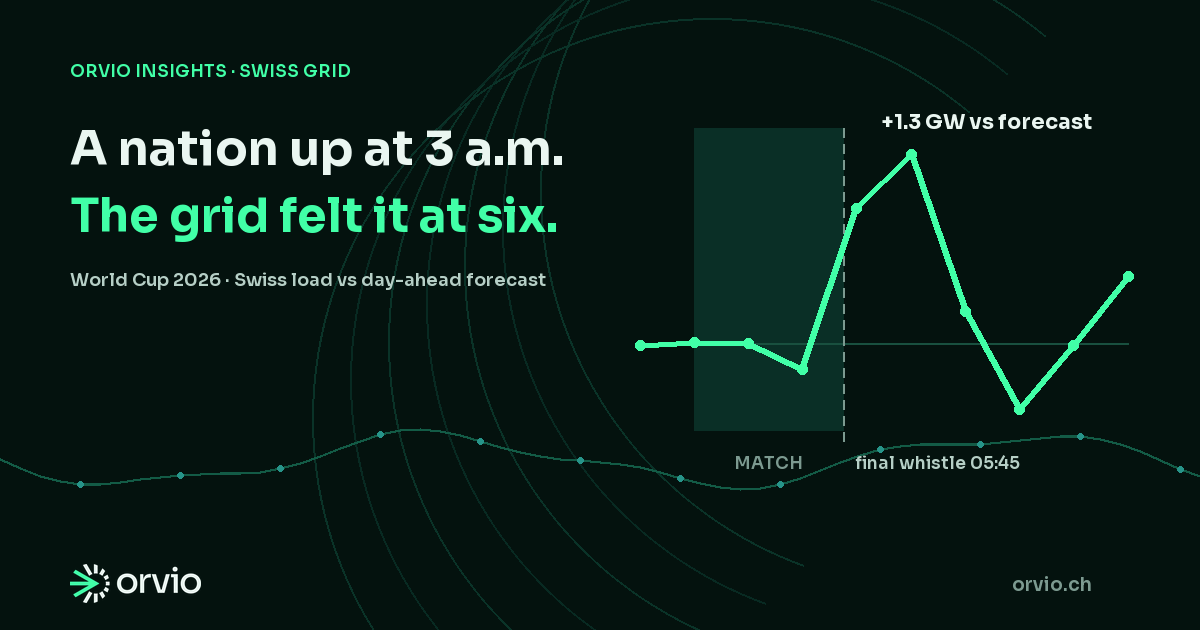
On the night of 11 to 12 July, a good part of Switzerland set an alarm for three in the morning. The national team was playing Argentina in a World Cup quarter-final, kicking off at 03:00 CEST. We build forecasting systems for the Swiss grid, so we asked the obvious question the next morning: what does a country full of early alarm clocks do to the power system?[1][2]
The tournament gave us two natural experiments. Switzerland's 2–0 round-of-32 win over Algeria on 3 July kicked off at 05:00 CEST; the 1–3 quarter-final defeat to Argentina on 12 July kicked off at 03:00 CEST, went to extra time and ended around 05:45. For both mornings we compared actual Swiss total load with the day-ahead forecast, then checked the residual control-area imbalance.[1][2][3][7]
While the country was watching, the grid barely noticed.
The intuitive story is that a nation switching on televisions in the middle of the night should show up as extra consumption. It does not. ENTSO-E publishes actual total load and the day-ahead forecast for the Swiss bidding zone at hourly resolution, and in both match windows the gap between the two stayed within ordinary variation. Modern televisions draw a few tens of watts; against a system running at around six gigawatts, even a couple of million of them disappear into the noise.[3][4][6]
Televisions are invisible to the grid. A whole country waking up early is not.
After the final whistle, the morning ramp arrived early.
The quarter-final ran long, and the final whistle came around 05:45. Over the next two hours, between 06:00 and 08:00 CEST, actual load exceeded the day-ahead forecast by an average of 1,129 MW, peaking at 1,317 MW at 07:00. Ranked against the same two hours on every calendar day from 1 May through 12 July, that Sunday morning is first out of 73.[3][4][5]

The explanation is mundane, which is what makes it useful. Nobody consumed more electricity than usual that morning; the country consumed it earlier. A large share of the population was awake two hours before the point a standard Sunday profile assumes, so the ramp that normally builds towards eight o'clock arrived towards six. On an ordinary morning the forecast error is flat, because the day-ahead profile already contains the ramp. A deviation like this only appears when the country wakes off-schedule.[3][4]
The Algeria morning shows the same shape. In the two hours after that match, from 08:00 to 10:00 CEST, load ran +720 MW above forecast. We read it as supporting evidence rather than proof: it was a Friday, the window overlaps an ordinary working morning, and a few match-free July mornings produced misses of similar size. The quarter-final is the clean exhibit.[1][3][4]
A gigawatt that mostly never reached the balancing market.
A 1.3 GW forecast miss sounds like it should be a system event. Swissgrid's residual system balance shows why it was not. The two series measure different things: the load comparison captures what the country did against what was scheduled, while the system balance is what remains after balance groups have adjusted their positions and balancing has acted. They cannot be subtracted from one another, but read side by side they show who caught the error.[4][7][8]

On the quarter-final morning the control area ran short for about two hours, bottoming at −276 MW at 08:00: real and sustained, but a fraction of the gap in the load schedule. The rest was closed upstream, in the intraday adjustments balance groups make as the morning unfolds. The Algeria morning makes the opposite point. The deepest excursion of that night, −185 MW at 05:45, fell in the middle of the match, exactly where the load data shows consumption on forecast. An imbalance chart alone would have told a good story about the wrong thing.[4][7][8]
The country missed its forecast by a gigawatt, and the market absorbed almost all of it.
What two mornings can and cannot say.
Two events are a hypothesis, not a law, and we hold this one accordingly. A shifted national wake-up is the most plausible reading of the quarter-final morning; weather, calendar quirks and plain forecast error can all contribute, and two observations cannot separate them cleanly. What the two mornings do establish is narrower and more useful: a static day-ahead load profile encodes assumptions about when a country wakes up, and when those assumptions break, they break by hundreds of megawatts for hours at a time.[3][4][1][2]
Model the alarm clocks, not the match.
Day-ahead profiles are excellent on days that resemble other days. The interesting failures are the predictable ones: the morning after an overnight national-team game, the transition into a holiday week, any event that moves a few million routines by an hour or two. Those are exactly the windows where short-horizon forecasting has to earn its keep, and where signals that track the morning as it actually unfolds are worth more than another refinement of the static profile.[4][5]
Data and methodology
The load comparison uses ENTSO-E document type A65 for Swiss area 10YCH-SWISSGRIDZ: process A16 for actual total load and A01 for the day-ahead total-load forecast, both at native PT60M resolution in UTC. The system cross-check uses Swissgrid's public Control Area Balance 2026 yearly CSV, column Total System Imbalance, at native PT15M resolution in UTC. Positive Swissgrid values mean long and negative values mean short. The selected Swissgrid series reproduces every Swissgrid value reported here.[3][4][5][6][8][7]
- Windows are half-open and labelled in Europe/Zurich: charts [02:00, 12:00), quarter-final in-match comparison [03:00, 06:00), Algeria in-match comparison [05:00, 07:00), quarter-final morning finding [06:00, 08:00), and Algeria morning finding [08:00, 10:00). Hourly timestamps mark interval starts. The in-match endpoints cover the native hourly intervals from the official kick-off through the hour containing Orvio's estimated final whistle; they are analysis definitions, not official final-whistle timestamps. The match bars on the load chart run from official kick-off to the estimated final whistle: 03:00–05:45 for the quarter-final including extra time, and 05:00–06:55 for the Algeria match. Every in-match load deviation remained inside the same-clock 67-day mean plus or minus one sample standard deviation.
- The quarter-final ranking uses all 73 complete calendar days from 1 May through 12 July 2026. Rank is descending by the signed arithmetic mean of the 06:00 and 07:00 observations; no eligible day was removed for missing data.
- The chart reference mean and one-sample-standard-deviation band use 67 complete non-match days. They exclude Switzerland’s six World Cup match days: 13, 18 and 24 June and 3, 7 and 12 July. A candidate reference day is excluded if any required hourly ENTSO-E or 15-minute Swissgrid observation in [02:00, 12:00) is missing; no additional reference day was removed for missing data.[1]
- We converted UTC interval starts to Europe/Zurich only for local-date and clock-window selection. We applied no resampling, interpolation or forward-fill. Two-hour findings are arithmetic means of two native hourly observations.
- Both extracts were retrieved at 2026-07-18T10:48:46Z. ENTSO-E actual total load is published no later than H+1 after the operating period and can be revised, so none of this implies the same signal was available live before each delivery interval. Swissgrid describes recent control-area values as indicative and subject to revision.
- This is an observational comparison of two events. It does not establish causation.
Sources
- 1.Switzerland's World Cup 2026 fixtures and results (opens in a new tab)
Swiss Football Association · Fixture and results page; retrieved 18 July 2026 ·
- 2.Argentina beat Switzerland in quarters: match report and highlights (opens in a new tab)
FIFA · Match report; retrieved 18 July 2026 ·
- 3.Total Load – Day Ahead / Actual (opens in a new tab)
ENTSO-E Transparency Platform · A65 data view for 10YCH-SWISSGRIDZ; retrieved 18 July 2026 ·
- 4.Actual Total Load and Day-ahead Total Load Forecast per Bidding Zone (opens in a new tab)
ENTSO-E Transparency Platform · Updated 24 June 2026; retrieved 18 July 2026 ·
- 5.Implementation Guide for Transparency Platform data extraction (opens in a new tab)
ENTSO-E Transparency Platform · Current implementation guide; retrieved 18 July 2026 ·
- 6.Detailed Data Descriptions (opens in a new tab)
ENTSO-E · Version 1.2; retrieved 18 July 2026 ·
- 7.Control energy and system balance (opens in a new tab)
Swissgrid · Current data-definition page; retrieved 18 July 2026 ·
- 8.Swiss energy data and revisions (opens in a new tab)
Swissgrid · Control Area Balance 2026 yearly file; retrieved 18 July 2026 ·