
What is PV curtailment actually worth in Switzerland?
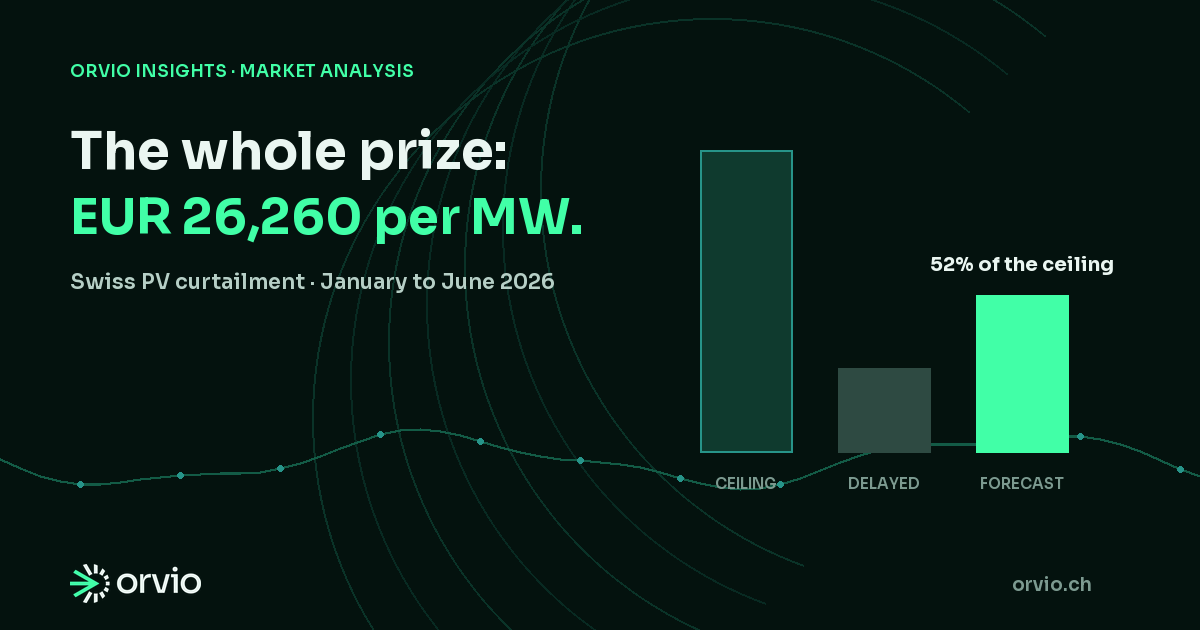
Curtailing into negative imbalance prices could have avoided up to EUR 26,260 per MW in gross imbalance costs in the first half of 2026. A cautious rule on delayed public data captured 28% of that; a forecast-driven rule captured 52%.
Orvio Research
By Orvio
Published by Orvio Energy Intelligence AG
Since January 2026, Switzerland settles imbalance energy at a single price. When the control area is long and that price turns negative, feeding in costs money instead of earning it. The cost falls on whoever carries the balance-group position, and curtailing a plant for those quarter-hours turns it into a saving.[2][3]
That exposure sits with utilities, direct marketers and the aggregators that switch plants for them. Owners of large PV portfolios may share in the value through their PPA, direct-marketing or flexibility agreement, so the question has two parts: how much gross value curtailment creates, and how that value is split. Public data can settle the first.
For every quarter-hour from January to June 2026 we asked what curtailing a plant would have been worth at the price that actually applied. Production comes from Pronovo's definitive quarterly profiles, normalised to one megawatt of installed capacity, so the figures scale to whatever share of a fleet is genuinely controllable; prices and the control-area balance are published by Swissgrid. We assume compensation for curtailed energy equals the forgone feed-in remuneration, so the two offset and what remains is the avoided imbalance cost.[1][3][4]
The prize is real, and highly seasonal.
The ceiling is EUR 26,260 per megawatt over six months. That is what perfect foresight would have avoided – curtailing exactly the quarter-hours that turned out negative, and none of the others. Nobody has that knowledge at the moment of the decision and no real rule reaches it, but it sets the size of the opportunity.[1][3]
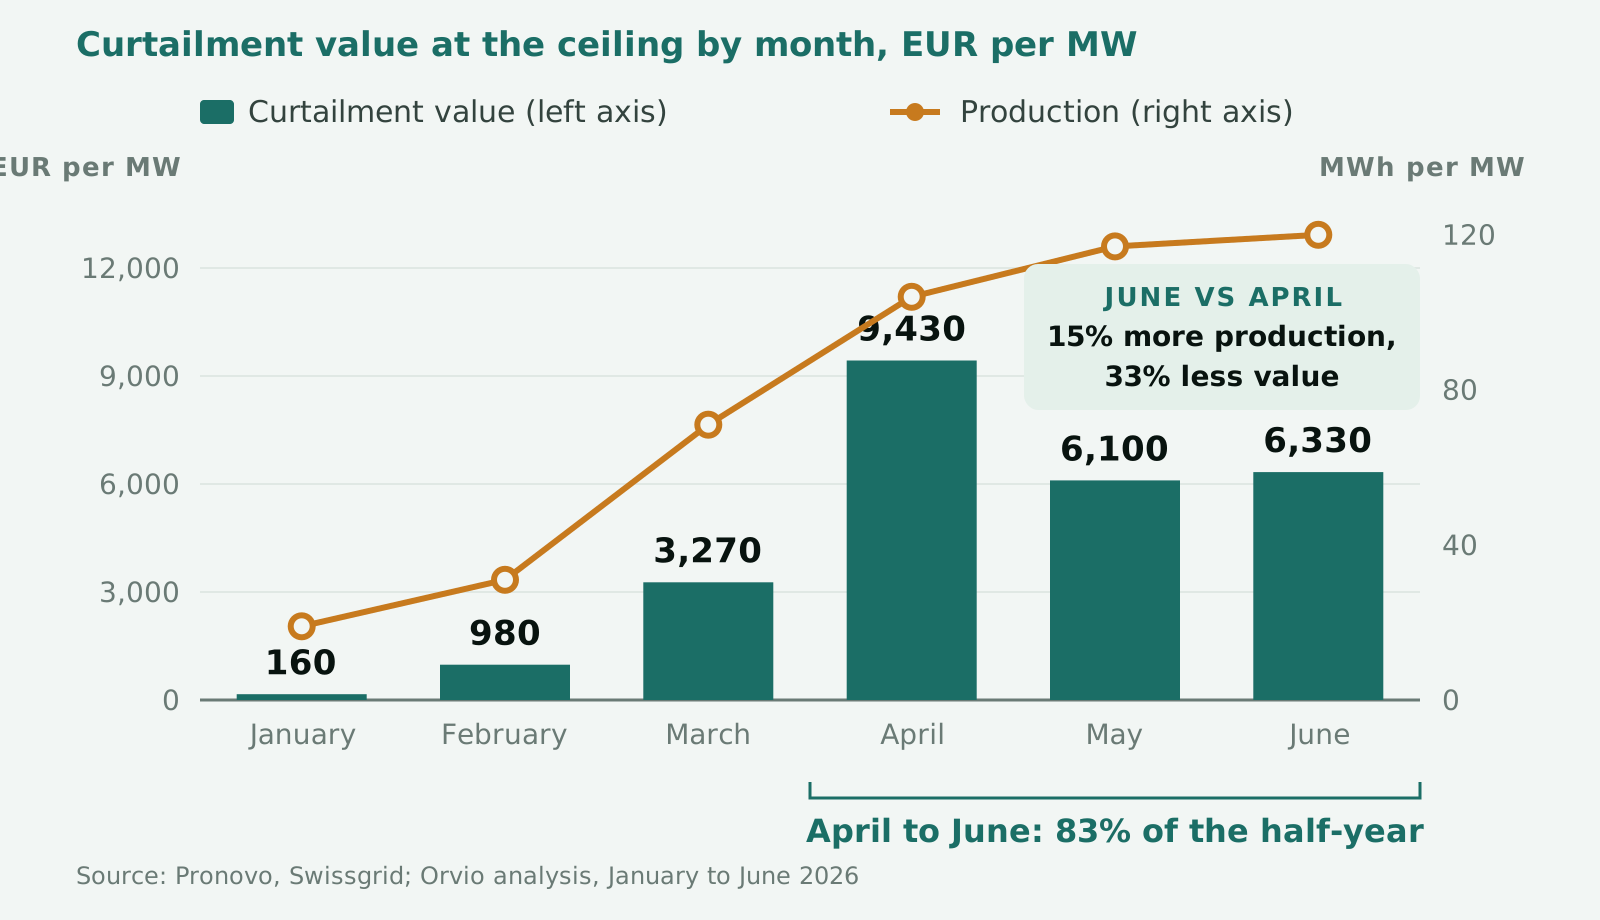
The value is highly seasonal: 83% of it fell in April, May and June, against EUR 160 per megawatt in all of January. The seasonal part is no surprise. The ranking inside that quarter is: April was worth EUR 9,430 per MW and June only EUR 6,330, even though June generated 15% more.
Two conditions have to hold at once for curtailment to be worth much. The first is volume: enough PV in the system for a surplus to build at all, which is why the second quarter dominates the first. The second is depth, and that is where April and June differ. Every megawatt-hour curtailed in April avoided EUR 300 on average; in June only EUR 150.
One reading is that spring weather is less settled. When output arrives that the market did not schedule, prices overshoot; by midsummer a surplus is broadly anticipated and already priced in.
Exhibit: Curtailment value peaked in April, two months before production did.
Location matters, but annual PV yield is a weak proxy for curtailment value.
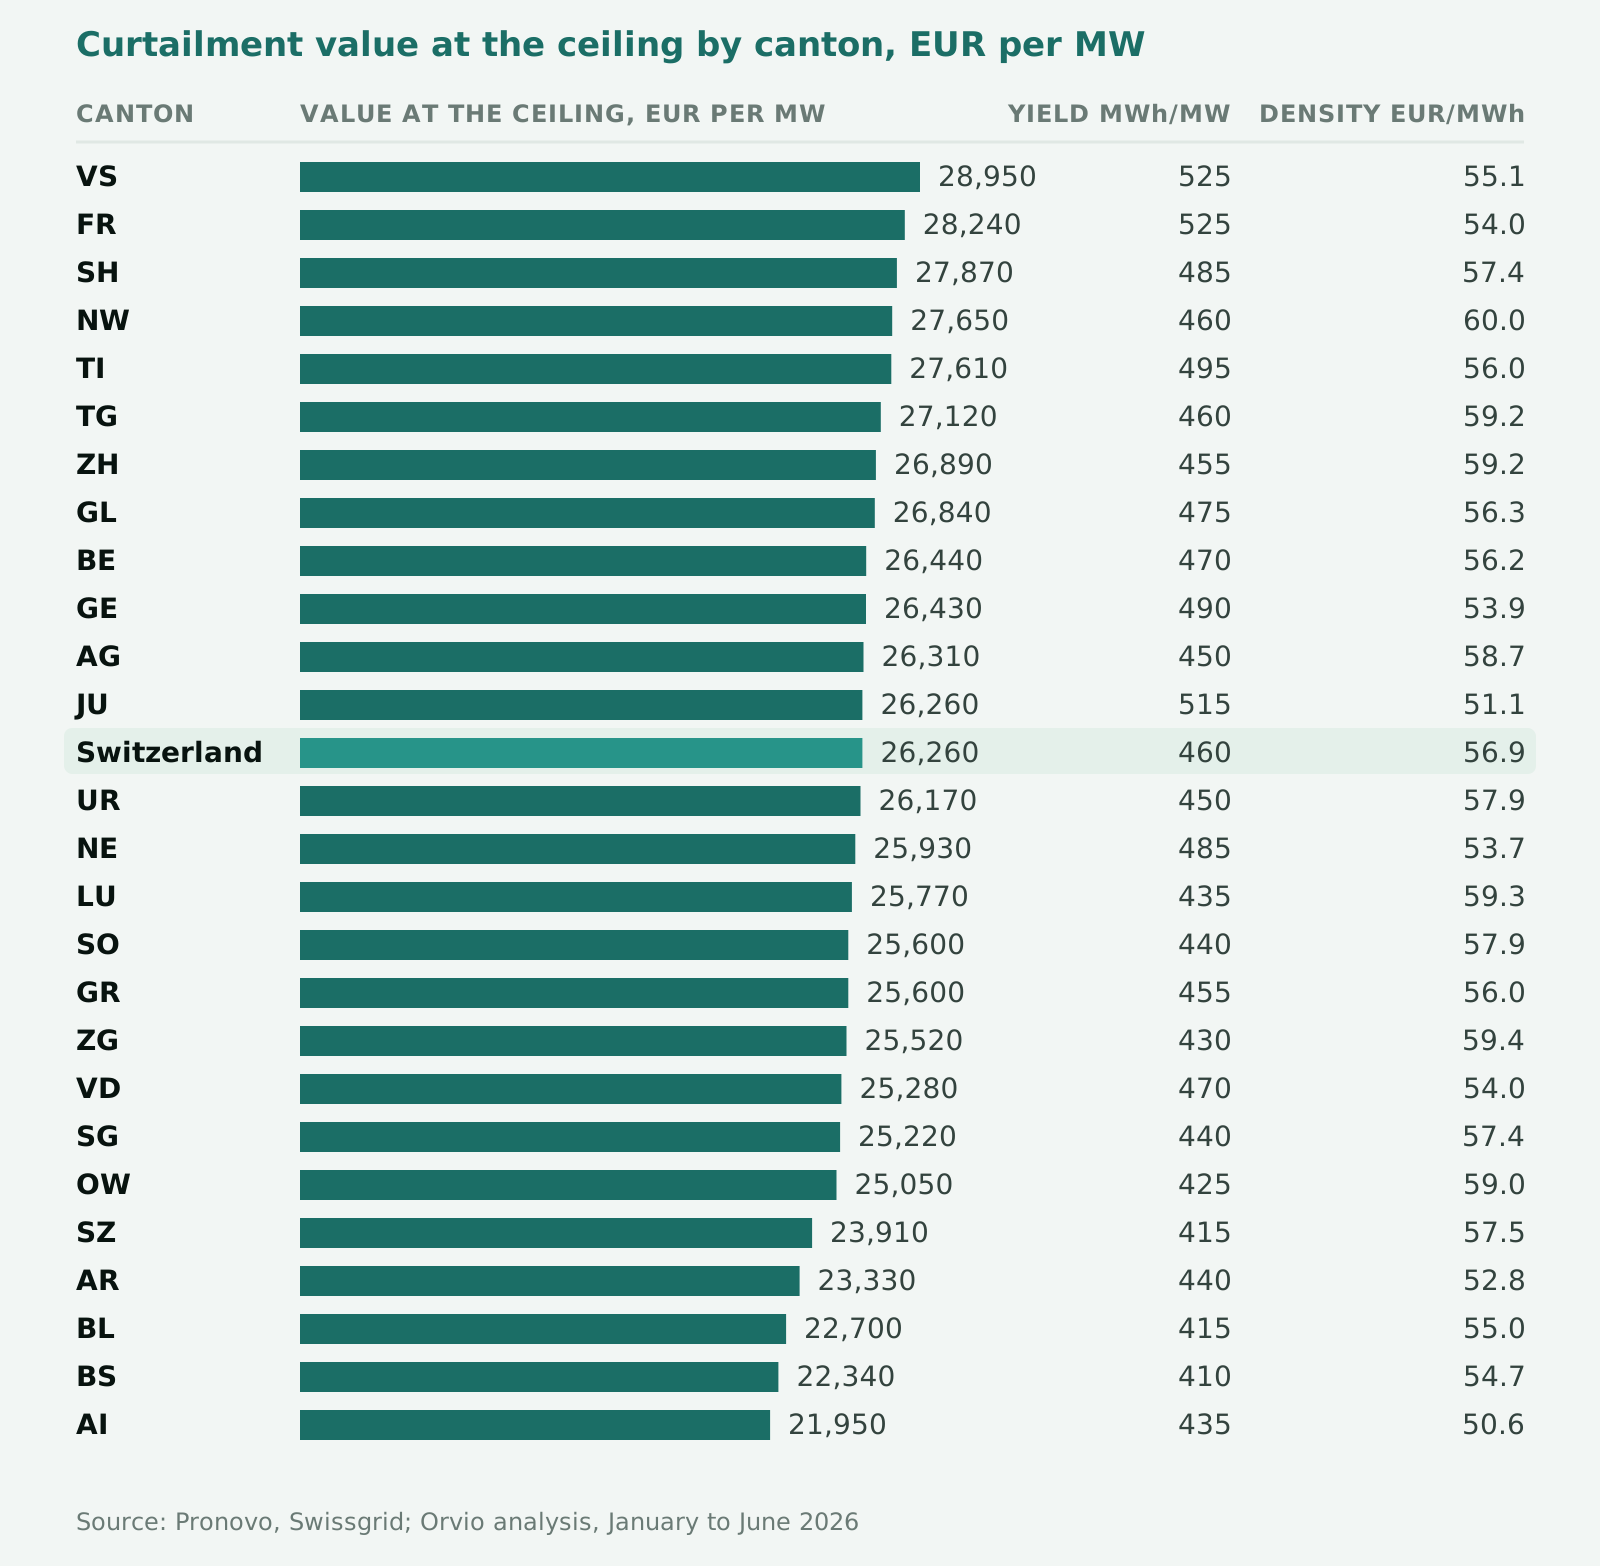
Curtailment value scales with yield, but not proportionally. Across the 26 cantons a 10% increase in yield bought only about 8% more value: yield runs from 409 to 526 MWh per MW, the ceiling from EUR 21,950 to EUR 28,950.[1]
Measured per megawatt-hour generated, the ranking shifts. Value density runs from EUR 51 to EUR 60 per MWh, and the cantons at the top of the yield table are not the ones at the top of the density table.
Negative prices appear when everyone feeds in at once. Valais generated 72 MWh per MW more than Zurich over the half-year, but only 14% of that additional output landed in a quarter-hour with a negative price, against 27% for the national profile as a whole. Much of it came in winter, or on days when the plateau sat under cloud – precisely the hours when national PV output is low and the price does not collapse.
For the canton itself that is a good outcome. Output meeting a positive price earns money as energy, which is what a plant is built for, and curtailment remains a remedy for over-production rather than a return in its own right. The practical consequence is narrower: size the curtailment case on how much of a portfolio's output coincides with negative prices, and treat annual yield as a weak proxy for it.
Exhibit: Sunnier cantons are worth more, but not proportionally more.
Delayed data leaves most of the prize on the table.
The binding constraint is latency, not caution. Swissgrid publishes the imbalance price and the control-area balance for every quarter-hour, but with a delay. Just before a quarter-hour starts, the newest value available is about 45 minutes old.[3][5]
A conservative rule on that delayed signal collected EUR 7,300 per MW, or 28% of the ceiling: curtail only when the delayed price was below −150 EUR/MWh and the control area was long by more than 150 MW. These are thresholds we have seen operators apply in the market. The best that any fixed threshold on the same signal could have done is EUR 11,640, or 44%, at −60 EUR/MWh with no balance condition. We found that by searching the whole grid after the fact, which is the point: an operator setting a threshold in January had no way of knowing it.
The threshold does real work here. A delayed price is one observation drawn from a volatile distribution with heavy tails, so a value from 45 minutes ago says comparatively little about the value now. An operator acting on every negative reading will therefore act partly on noise, curtailing and then releasing again minutes later. Setting the cut-off deep filters that out, because only an extreme last observation is likely to still describe the current quarter-hour.
Thresholds buy precision and pay for it in volume.
Every step toward precision costs more volume than it gains. Counting how often each rule would have curtailed, how often the price really did settle negative, and what each collected:
| Rule on the 45-minute delayed signal | Interventions | Correct | Hit rate | Value (EUR/MW) |
|---|---|---|---|---|
| No threshold | 1,808 | 757 | 42% | 10,920 |
| Ex-post optimal (−60 EUR/MWh) | 1,029 | 498 | 48% | 11,640 |
| Conservative (−150 EUR/MWh, +150 MW) | 240 | 144 | 60% | 7,300 |
Moving from no threshold to the conservative rule lifts the hit rate from 42% to 60% and cuts interventions by 87% – and collects EUR 3,620 less. The most accurate rule of the three is the one that earns least.
A dedicated forecast for the Swiss control area removes the reason for the threshold.
Forecasting the coming quarter-hour changes what the threshold is for. Instead of reacting to a single observation from 45 minutes earlier, the operator acts on an expected price for the delivery period itself, with the extremes already weighted in. The protection a deep cut-off buys therefore comes built in, without the loss of volume.
On our own forecasts, replayed strictly out of sample, curtailing whenever the expected price is below zero – with no thresholds at all – collected EUR 13,640 per MW, or 52% of the ceiling. Against the conservative delayed-data rule that is about EUR 6,340 more per MW over six months; against the ex-post optimal threshold, about EUR 2,000. Adding a correction five minutes after the delivery period starts raised it to EUR 14,630, or 56%, but only for plants that can be re-dispatched inside the quarter-hour.
Exhibit: Same plant, same prices: the decision rule sets the payoff.
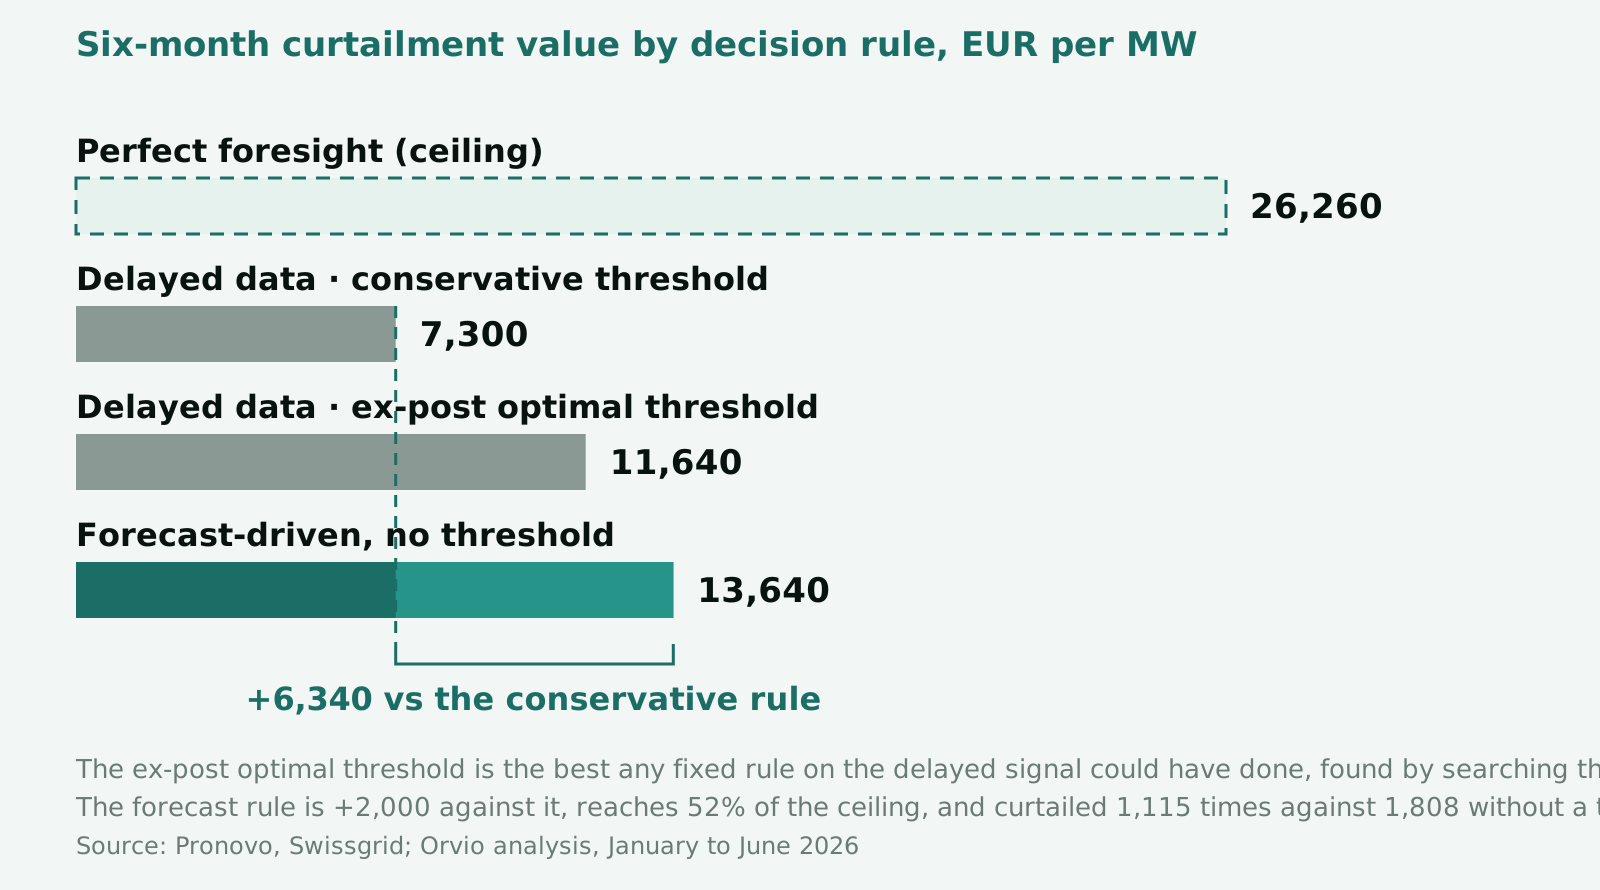
The gain comes from selection rather than volume. Against the unthresholded rule on delayed data the forecast curtailed fewer quarter-hours, 1,115 against 1,808, and still collected EUR 2,720 more. The quarter-hours it did curtail were the deep ones.
These forecasts were generated walk-forward: the model was retrained each day on data available up to the previous day and never saw the period it predicted. All values are modelled gross balance-group figures, not realised earnings, and they cover a single half-year.
Quantify the curtailment value of your portfolio
The national profile is an average, and no portfolio is average. The value depends on where the PV assets are located, how much of them can actually be curtailed, and what the compensation structure looks like. Tell us more about your PV assets' locations, installed capacity and controllable share, and we will run this analysis on your fleet – including what a forecast-driven policy would have earned against the rule you use today.
Data and methodology
Production profiles are Pronovo quarter-hourly technology profiles for photovoltaics, definitive quarterly files for Q1 and Q2 2026, for all 26 cantons and for Switzerland as a whole. Installed capacity is reported at month end and applied to that month; every profile is normalised to one megawatt. Prices and the control-area balance come from Swissgrid's published Control Area Balance 2026 file, retrieved 27 July 2026. Pronovo labels a quarter-hour by its end and Swissgrid by its start, so the two are matched to the same physical interval; Swissgrid states the imbalance price in EUR cents per kWh, which we convert to EUR/MWh. The window covers 17,372 quarter-hours from 31 December 2025 23:00 UTC to 30 June 2026 21:45 UTC, of which 1,808 settled at a negative price.[1][3][4][5]
- Curtailment value for a quarter-hour is the production that would have been curtailed multiplied by the imbalance price, counted only where the rule under test would in fact have curtailed. Compensation for curtailed energy is assumed to equal the forgone feed-in remuneration, so the two offset and the remainder is the avoided imbalance cost.
- The delayed-data benchmark uses the price and control-area balance from three quarter-hours earlier, about 45 minutes of effective age. Swissgrid also publishes faster provisional values, which it describes as indicative and subject to revision; the benchmark deliberately uses the settled series a rule can rely on. The conservative rule curtails below −150 EUR/MWh with the control area long by more than 150 MW. The ex-post optimal rule is the value-maximising fixed threshold over a grid of price cut-offs from 0 to −200 EUR/MWh and balance conditions of 0, 50, 100 and 150 MW; it lands at −60 EUR/MWh with no balance condition. It is optimal only in hindsight and is reported as an upper bound, not as a usable setting.
- Orvio figures come from a walk-forward replay. For every delivery day the model was retrained on data available up to the previous day, with a one-day embargo, and then applied to that day, so no observation from a predicted day entered its own training set. The correction variant commits one third of the quarter-hour on the forecast issued shortly before delivery and the remaining two thirds on a revision issued five minutes after the period starts, which is why that revision can only cover ten of the fifteen minutes.
- The national total is the Pronovo Switzerland profile, 6,078 MW of reported capacity at the end of June 2026. The cantonal comparison applies the same method to each cantonal profile. Value density is curtailment value at the ceiling divided by production over the same window.
- The analysis treats the plant as a price-taker. That holds at the scale of a single megawatt and breaks down for large fleets: curtailing tens of megawatts moves the control-area balance itself, and therefore the price being avoided, so the per-MW figures cannot simply be multiplied up.
- Limitations. Per-MW values are gross balance-group settlement values in euros, rounded to the nearest 10 EUR for publication; value density is rounded to the nearest euro per MWh. They are modelled rather than realised earnings. They also assume a plant can be curtailed without technical or contractual restriction, which no real fleet can: AC versus DC rating, self-consumption and the controllable share leave materially less addressable capacity than nameplate, and whether the plant owner shares in the value is a contract term rather than a market outcome.
- This is a single half-year, and a seasonally incomplete one by construction: it contains one spring but no second summer and no autumn. Swissgrid describes recent control-area values as indicative and subject to revision.[4]
Sources
- 1.Load profiles by technology (opens in a new tab)
Pronovo AG · Quarter-hourly photovoltaic production profiles, definitive quarterly files Q1 and Q2 2026; retrieved 27 July 2026 ·
- 2.New pricing mechanism for balancing energy from 2026 (opens in a new tab)
Swissgrid · News announcement published 28 March 2025; retrieved 27 July 2026 ·
- 3.Imbalance energy (opens in a new tab)
Swissgrid · Current web page and publication archive; retrieved 27 July 2026 ·
- 4.Control energy & system balance (opens in a new tab)
Swissgrid · Current definitions and indicative-data page; retrieved 27 July 2026 ·
- 5.Swiss energy data and revisions (opens in a new tab)
Swissgrid · Control Area Balance 2026 yearly file; retrieved 27 July 2026 ·